
What Americans Pay for Power — And the Forces That Decide It
By Don Keyhoetea · July 11, 2026 · 3 min read
Bottom Line
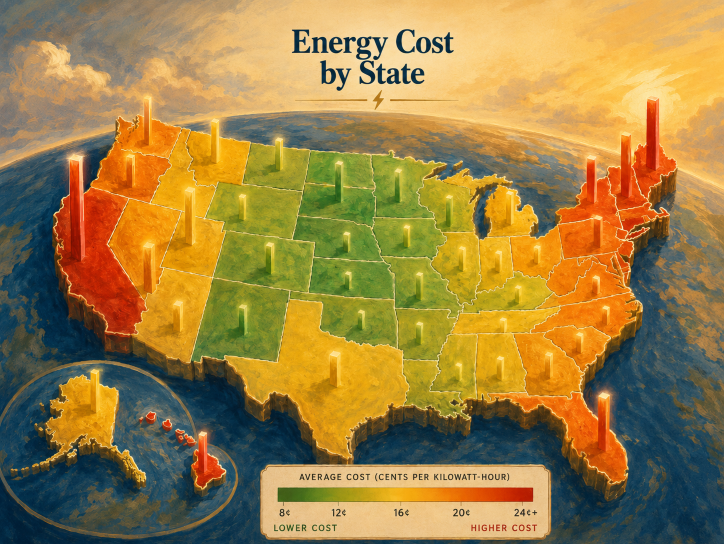
American electricity prices vary by nearly fourfold across states. Geography sets the range; policy choices — mandates, permitting, and procurement — determine where a state lands within it. The partisan gap is real and substantially chosen.
Why It Matters
Electricity is a non-optional purchase for every household and business. Understanding what drives the gap between a 12-cent state and a 35-cent state is prerequisite to evaluating any climate, industrial, or affordability policy on the ballot.
Background & Context
Residential electricity in the United States is priced by state, not federally. Rates are set through a combination of wholesale generation markets, transmission and distribution costs, and retail rate design approved by state public utility commissions. The federal government influences rates indirectly — through environmental regulation, federal hydropower marketing agencies like the Bonneville Power Administration and the Tennessee Valley Authority, and interstate transmission oversight — but the headline number a household sees on its bill is the product of decisions made largely at the state level.
The Energy Information Administration publishes rates monthly. The figures cited throughout this analysis reflect EIA's Electric Power Monthly data for residential customers in March and April 2026, the most recent full-coverage dataset available. Residential rates are used because they are the number households recognize; industrial and commercial rates follow different patterns and are discussed separately where relevant.
Two structural facts frame everything that follows. First, electricity cannot be economically stored at grid scale in large volumes, so supply and demand must match instantaneously — meaning the marginal cost of generation at peak demand often sets the price for the whole system. Second, the generation fleet a state operates today was built across nearly a century of different political and economic priorities, and current rates reflect the cumulative weight of decisions made across that span. Recent policy moves the number visibly; older decisions are baked into the baseline.
The Evidence
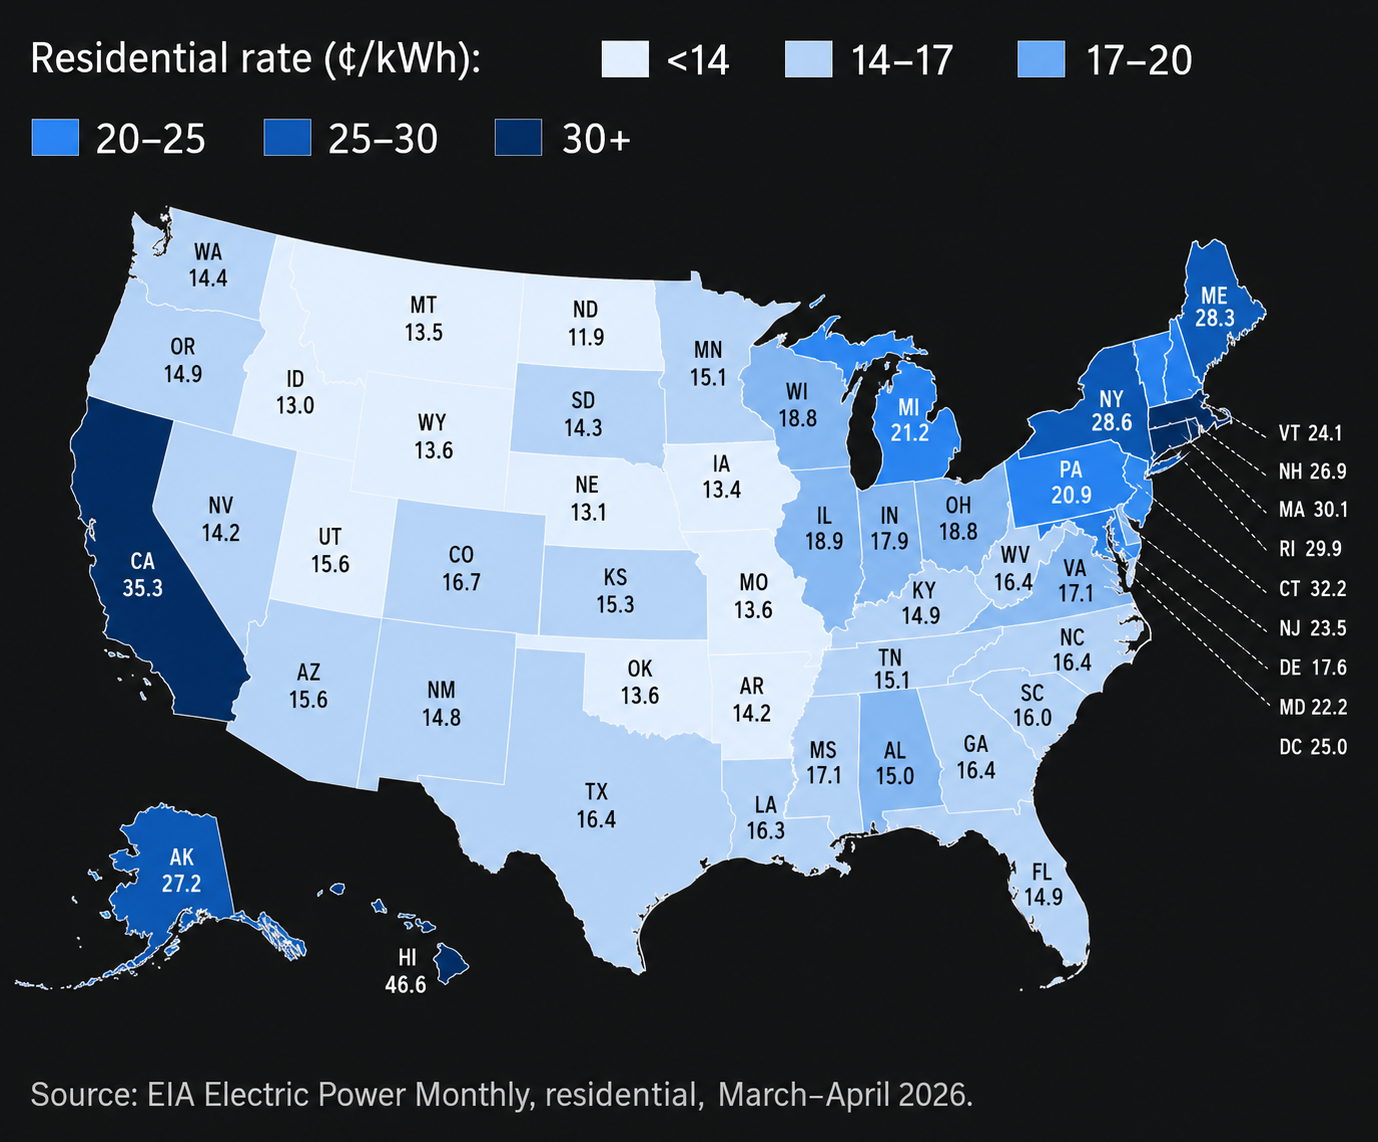
The national range is wide, and the extremes are separated by nearly a factor of four. North Dakota residents pay 11.9 cents per kilowatt-hour. Hawaii residents pay 46.6 cents. The national average sits at approximately 18.6 cents. The ten cheapest jurisdictions are North Dakota, Idaho, Nebraska, Utah, Iowa, Missouri, Montana, Oklahoma, Wyoming, and Arkansas. The ten most expensive are Hawaii, California, Connecticut, Massachusetts, Rhode Island, New York, Maine, Alaska, New Hampshire, and the District of Columbia.
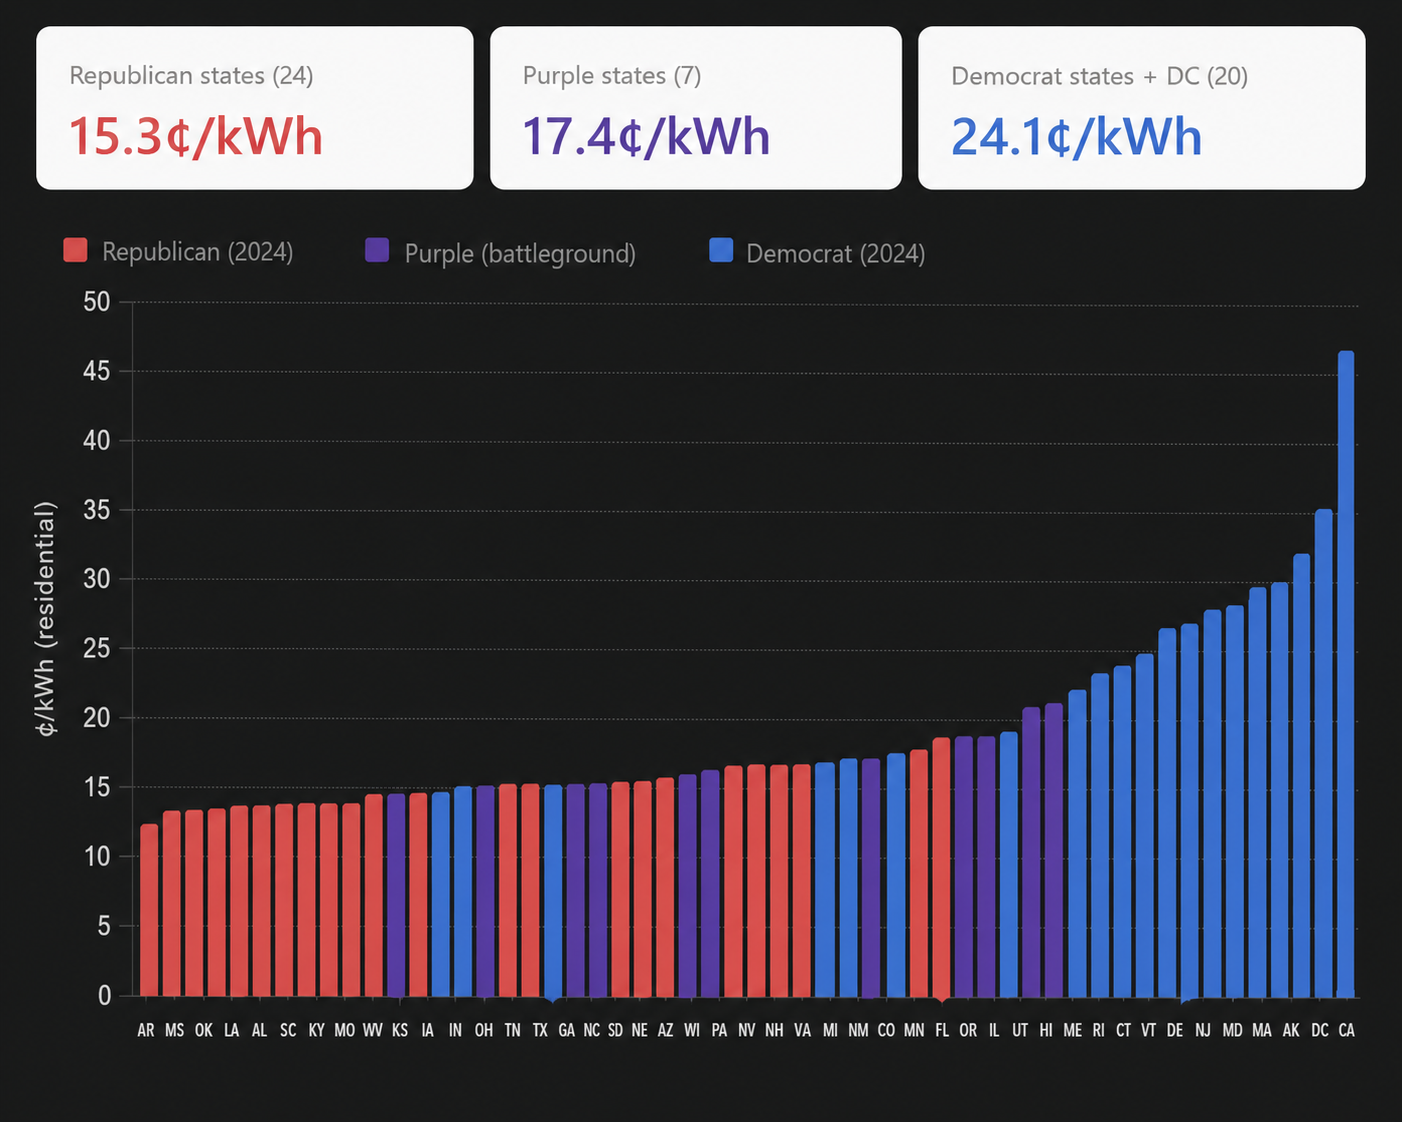
Grouped by 2024 presidential vote, the averages are stark. States that voted Republican average 15.3 cents. The seven battleground states average 17.4 cents. States that voted Democratic, plus the District of Columbia, average 24.1 cents. That represents a 57 percent premium for residents of Democratic-voting states over Republican-voting states in raw rate terms. The ten cheapest jurisdictions are all Republican-voting states; fifteen of the sixteen most expensive are Democratic-voting.
Matched pairs isolate the policy signal from the geography signal. California and Arizona share desert geography, abundant sun, and rapid population growth. California pays 35.3 cents; Arizona pays 15.6 cents — a gap of nearly 20 cents on identical resources. Pennsylvania and West Virginia sit atop the same Appalachian coal and gas resources within the same PJM electricity market. Pennsylvania pays 20.9 cents; West Virginia pays 16.4 cents. Massachusetts and New Hampshire share a New England grid and comparable fuel-import exposure; Massachusetts pays 30.1 cents and New Hampshire 26.9 cents. In each pair, the state with the more aggressive renewable procurement mandate and higher regulatory compliance burden pays more.
Hawaii's rates reflect both geographic constraint and layered policy choice. Island isolation prevents pipeline access to mainland natural gas, forcing reliance on imported petroleum. Geography sets a high floor. On top of that floor, Hawaii adopted the nation's first 100 percent renewable portfolio standard in 2015, retired its last coal plant in 2022 without cheap replacement firm capacity, and maintains separate isolated grids on each island rather than an inter-island transmission cable that would allow reserve sharing. Grid modernization and solar-plus-storage procurement costs are recovered through rates. Geography alone would make Hawaii expensive. Policy makes it 46.6 cents.
New England follows the same pattern, and its geographic disadvantage is substantially a policy outcome. Major pipeline expansions designed to move Pennsylvania and Appalachian gas into New England — Northeast Direct, cancelled in 2016, and Access Northeast, cancelled in 2017 — died in state permitting fights across New York and Massachusetts. The region imports liquefied natural gas at premium prices during peak winter demand as a direct consequence of those blocks. Massachusetts, Connecticut, and Rhode Island then layered among the most aggressive state renewable portfolio standards in the country on top of that constrained baseline, and the region retired the Vermont Yankee (2014) and Pilgrim (2019) nuclear plants — carbon-free baseload capacity that would have offset winter gas demand. Rates above 29 cents in those three states reflect the cumulative weight of those choices.
California's premium is the clearest single case of policy-driven cost. California has abundant sun, in-state natural gas production, and a mild climate that reduces heating demand. On raw geography it should be among the cheaper large states. Instead it is second-most-expensive in the nation. The gap reflects a stack of state-level decisions: SB 100's 100 percent clean electricity mandate by 2045, wildfire liability socialized through utility rates rather than tort or general revenue, cap-and-trade compliance costs, and among the nation's highest transmission and distribution investment recovered through rates. Arizona next door — same sun, same desert — pays less than half as much.
Virginia is the live case of policy shifting rates in real time. Virginia's 2020 Clean Economy Act, passed under a Democratic trifecta, mandated 100 percent carbon-free electricity by 2045 and required specific procurement targets for offshore wind and solar. Since passage, Virginia residential rates have risen meaningfully faster than the national average, and Dominion Energy has cited compliance-driven procurement as a rate-case justification. A subsequent Republican administration has been unwinding portions of the mandate. This is the rate map being drawn in real time, not decades after the fact.
Renewable adoption itself does not explain the rate gap; the mechanism is fleet turnover cost. Iowa generates approximately 61 percent of its electricity from renewables and pays 13.4 cents. Oklahoma is the nation's third-largest wind power producer and pays 13.6 cents. New Mexico generates roughly half its power from renewables and pays 14.8 cents. In each case, wind was adopted because it was the cheapest new capacity available on the local grid — the marginal megawatt, not a mandated replacement for existing generation. When renewables are added to a grid to meet growth or replace already-retired capacity, they are cheap. When renewables are mandated to replace a not-yet-amortized fossil fleet on a compressed timeline, ratepayers absorb stranded asset costs, new transmission to distant generation sites, storage or firming capacity for intermittent supply, and administrative compliance overhead. The states paying 30-plus cents are almost universally in the second category.
The forward-looking pressure comes from data center demand. In the past year, the fastest-rising residential rates have appeared in PJM territory — the District of Columbia at 22.5 percent, New Jersey at 18.2 percent, New Hampshire at 18 percent — driven substantially by commercial and industrial load growth outpacing generation and transmission expansion. These increases affect states across the political spectrum within that regional grid and are beginning to reshape the interstate comparison.
The Analysis
Geography sets the range within which each state's rate can fall; policy determines where within that range the state actually lands. No policy choice can make Hawaii as cheap as North Dakota. Island fuel-import costs are a floor. But a state's location within its geographic range is a policy question, and the evidence shows that range is often wider than the partisan defense of high-rate states admits. Hawaii's floor is perhaps 25 to 30 cents on geography alone; policy has pushed it to 46.6. California's floor is perhaps 14 to 16 cents on geography alone; policy has pushed it to 35. These are not small residuals. Policy is doing substantial work.
The matched pairs are the analytical hinge. California and Arizona, Pennsylvania and West Virginia, Massachusetts and New Hampshire — each pair holds geography approximately constant and lets policy vary. In every case, the state with more aggressive renewable procurement mandates, tighter permitting for fossil fuel infrastructure, or more expansive cost recovery through rates pays more. This is not a subtle finding. The consistency across independent matched pairs suggests the mechanism is real and the effect is measurable.
The mechanism connecting policy to rates operates through fleet turnover, not renewable adoption per se. Iowa proves renewables can be cheap. What Iowa did not do — and what California, Massachusetts, and New York did — was mandate the early retirement of existing fossil generation before its useful life ended. When a coal or gas plant is retired on schedule, ratepayers pay for the amortized capital and the replacement together. When a plant is retired early to meet a mandate deadline, ratepayers pay for the stranded remaining book value on top of the replacement. Add mandate-driven transmission to reach renewable generation sites, plus storage or firming capacity to backstop intermittent supply, and the compliance cost stack is substantial. This is the specific mechanism by which policy raises rates. It is not a mystery or a partisan interpretation; it is fleet-turnover accounting.
Population and density affect rates through cost-recovery mechanics, not raw size. Rate-setting spreads fixed costs across a customer base. Two variables move in opposite directions. A larger customer base means more denominators to spread costs across, lowering per-customer rates. A larger customer base on a constrained grid competes for scarce fuel and transmission, raising marginal costs. The Northeast experiences the second effect without much benefit from the first. The Plains experience the first without much of the second. Texas has 30 million residents and pays 16.4 cents; Rhode Island has 1.1 million and pays 29.9 cents. Population by itself does not predict rates. The ratio of generation capacity to load does.
The partisan pattern in the data reflects both accumulated inheritance and current choice. The Republican-Democratic rate gap is real: 57 percent, measured cleanly, not an artifact of methodology. Some portion of that gap reflects geography — Democratic-leaning population centers concentrate on coasts with weaker fossil fuel access. But the matched pairs demonstrate that geography is not the whole story. Where geography can be held approximately constant, the policy signal is unmistakable and consistent. Democratic-trifecta states have systematically pursued policies — aggressive renewable procurement timelines, restrictive fossil fuel infrastructure permitting, expansive cost recovery through rates — that raise the compliance cost stack their ratepayers absorb. Those policies are choices, made through democratic processes, with rate implications documented in state utility commission dockets at the time of enactment.
The current wave of PJM rate increases is a different mechanism worth naming separately. The District of Columbia, New Jersey, Virginia, and Ohio are all experiencing double-digit year-over-year rate growth driven by data center load rather than renewable procurement. This pressure affects red-state Ohio and blue-state Maryland alike, and it may complicate future political overlays. It does not undo the existing gap; it adds a new variable on top.
Counterpoints
The strongest defense of high-rate-state policy is that these costs were chosen, not imposed. Voters in Massachusetts, Connecticut, California, and New York have repeatedly returned legislators who campaigned on the climate policies now visible in their rates. Ballot measures, RPS statutes, and pipeline permitting decisions moved through democratic processes with the rate implications on the record. Treating the resulting rate levels as a failure — rather than as a purchase — assumes voters were either deceived or irrational. Neither assumption survives contact with the electoral evidence on its face. The residents of high-rate states have been given repeated opportunities to reverse course and have consistently chosen not to. On this reading, the rate map shows not policy failure but policy success at extracting the cost voters agreed to pay for the outcomes they said they wanted. Whether the disclosure of those costs was full and honest at the time of the vote is a separate question.
A related counterargument concerns interstate dependence. State-level rate analysis treats each state as a closed system, but the American electricity grid is regional. Cheap-state rates depend in part on being able to sell surplus generation to expensive states — Oklahoma wind is economic partly because Texas and neighboring states buy the output, and Wyoming coal historically depended on export markets. Cheap states are partly cheap because expensive states exist to buy from them. Isolating state policy from grid interconnection dynamics oversimplifies.
The federal financing point cuts against a purely state-level reading of the rate map. The Rural Electrification Administration, the Bonneville Power Administration, the Tennessee Valley Authority, and the federal Columbia and Missouri River dam systems collectively subsidize electricity delivery in a substantial portion of the country. Analysts who present low-rate states as pure free-market success stories understate the accumulated federal investment underlying those rates. This does not defend high-rate-state policy; it complicates any claim that low rates are entirely the product of current state decisions.
Definitional choices about "clean" energy shift the picture. Excluding hydropower drops Washington from 75 percent renewable to 9.5 percent. Excluding nuclear reclassifies Illinois, South Carolina, and Tennessee. Comparisons that do not disclose their definitions can be misread. The core rate finding does not depend on the definition; the renewable-share comparison does.
Conclusion
American electricity prices are set by geography and shaped by policy. Geography defines the range within which a state's rates can plausibly fall. Policy determines where within that range the state actually lands. Both variables are real; neither can be dismissed without distorting the picture. But the matched pairs make clear that policy is doing substantial work — not marginal work — in the states that pay the most. California is not expensive because of the sun. Massachusetts is not expensive because of the ocean. Pennsylvania is not expensive because of the coal beneath it. Each of those states pays what it pays because of choices its legislature and utility commission have made, layered onto a geographic baseline.
The 57 percent premium is arithmetic. Republican-voting states average 15.3 cents. Democratic-voting states average 24.1 cents. That gap partly reflects geography and partly reflects policy choices about renewable procurement timelines, fossil fuel infrastructure permitting, and cost recovery through rates. The policy portion is not a marginal contributor. In the matched pairs where geography can be held approximately constant, policy accounts for gaps of ten to twenty cents per kilowatt-hour — hundreds of dollars a year for the average household.
The premium was chosen, and that fact strengthens rather than weakens the finding. Voters in the high-rate states elected the legislators who passed the mandates, reelected them after the rate impacts became visible, and continue to return them to office. Democratic processes produced these rates deliberately. Whether the tradeoff between higher rates and faster decarbonization is worth it is a values question voters get to keep answering at the ballot box. That the tradeoff exists, that it is large, and that it flows from specific policy choices rather than from geographic misfortune is not a values question. It is what the evidence shows.
Readers evaluating any future energy policy proposal now have a framework. What does the proposal require the existing generation fleet to do — retire early, run longer, be replaced? What transmission and firming capacity does compliance require? How are the costs recovered — through rates, through general revenue, through federal subsidy? A state's future rates will be set by the answers to those questions, layered onto the geographic baseline the state inherited. The map does not have to move in the direction it has been moving. It has moved that way because voters chose it to.
Sources
- 1. U.S. Energy Information Administration, Electric Power Monthly, Table 5.6.A — Average Price of Electricity to Ultimate Customers by End-Use Sector, March and April 2026 editions.
- 2. U.S. Energy Information Administration, State Electricity Profiles.
- 3. U.S. Energy Information Administration, Electricity Data Browser.
- 4. Bonneville Power Administration, Rate Schedules and BP-24 Rate Case Materials.
- 5. PJM Interconnection, Base Residual Auction Results and Reports.
- 6. North American Electric Reliability Corporation, Long-Term Reliability Assessment.
About the Author
Don Keyhoetea
Don Keyhoetea writes for Rebuke Nation, an independent publication focused on media analysis, political framing, and source-based accountability.
Never miss a critique.
Subscribe to our RSS feed and get every new fact-check and media analysis delivered directly to your reader — no algorithm, no noise.